Cap Rate Explained: Your Essential Guide to Real Estate Valuation and Investment Analysis
At Trading Costs, we believe in numbers-backed insights and real strategies, not vague advice. This comprehensive guide will demystify the Cap Rate, providing you with a data-driven, step-by-step methodology to calculate, interpret, and leverage this essential metric for your real estate investment decisions. Whether you’re eyeing your first income property or expanding an existing portfolio, mastering the Cap Rate is non-negotiable for smart, financially ambitious investors.
What is a Capitalization Rate (Cap Rate)? The Core Definition
At its heart, the Capitalization Rate (Cap Rate) is a financial metric used in real estate to indicate the rate of return expected on a real estate investment property based on its Net Operating Income (NOI). It essentially tells you how much income a property generates relative to its market value, assuming an all-cash purchase (i.e., before accounting for any debt financing).
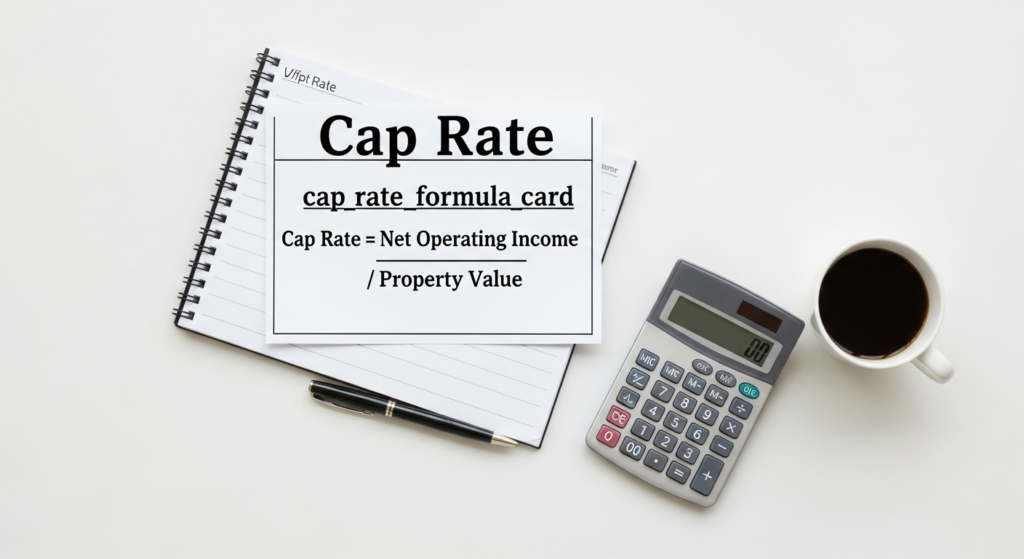
The formula is straightforward:
Cap Rate = Net Operating Income (NOI) / Property Value
Let’s break down the components:
Net Operating Income (NOI): This is the property’s annual income after deducting all necessary operating expenses, but before* accounting for mortgage payments, depreciation, or income taxes. It represents the property’s unleveraged, pre-tax cash flow from operations.
* To calculate NOI:
1. Start with Gross Scheduled Income (the total potential rental income if the property were 100% occupied at market rates).
2. Subtract Vacancy and Credit Loss (income lost due to vacant units or tenants failing to pay rent). This gives you Effective Gross Income (EGI).
3. Subtract Operating Expenses. These include property taxes, insurance, utilities (if landlord-paid), property management fees, repairs, maintenance, landscaping, and other costs directly related to the property’s operation.
Crucial Exclusion: Operating expenses do not* include mortgage payments (principal or interest), capital expenditures (major replacements like a new roof or HVAC system), depreciation, or income taxes. These are handled separately in a full financial analysis.
* Property Value: This is the current market value of the property. When you’re evaluating a potential acquisition, this is your proposed purchase price. If you’re assessing an existing asset, it’s the current estimated market value.
In essence, the Cap Rate measures the unleveraged yield of a property. It’s a snapshot of the property’s profitability in a given year, relative to its price.
Why Cap Rate is Indispensable for Real Estate Investors
For savvy investors, the Cap Rate serves multiple critical functions, making it an indispensable tool in real estate analysis:
1.
A Valuation Tool
When you know the market Cap Rate for similar properties in an area and you’ve calculated a property’s NOI, you can use the Cap Rate formula to estimate the property’s market value. This is particularly useful for commercial real estate and larger multi-unit residential properties where direct comparable sales might be scarce or complex.
Property Value = Net Operating Income (NOI) / Market Cap Rate
This allows you to quickly assess if a seller’s asking price aligns with market expectations based on the income it generates.
2.
A Comparative Metric
The Cap Rate provides a standardized way to compare different investment opportunities. By calculating the Cap Rate for various properties, you can quickly gauge which ones offer a higher potential return relative to their cost, assuming similar risk profiles. This “apples-to-apples” comparison is most effective when evaluating properties of the same type (e.g., multifamily to multifamily, retail to retail) within the same submarket.
3.
A Risk Indicator
Generally, a higher Cap Rate implies a higher potential return, but often also a higher level of risk. Properties with higher Cap Rates might be located in less desirable areas, have older infrastructure, or face greater vacancy challenges. Conversely, lower Cap Rates typically indicate lower risk, more stable income streams, and properties in prime locations or with strong tenant profiles. Investors must weigh their risk tolerance against the potential returns indicated by the Cap Rate.
4.
An Indicator of Market Sentiment
Cap Rates are dynamic and reflect broader market conditions. A general compression of Cap Rates (meaning they are decreasing) often indicates a strong seller’s market, where property values are rising faster than NOI, suggesting high demand and investor confidence. Conversely, an expansion of Cap Rates (meaning they are increasing) can signal a softening market, where property values are declining or NOI growth is stagnant, suggesting caution among investors. Monitoring Cap Rate trends in your target market provides valuable insight into the prevailing economic environment.
How to Calculate Cap Rate: A Step-by-Step Guide with Practical Examples
Calculating the Cap Rate accurately requires a systematic approach to ensure all relevant income and expenses are considered. Here’s how to do it:
Step 1: Calculate Gross Scheduled Income (GSI)
This is the total potential income the property could generate if fully occupied and all tenants paid on time.
* For residential rentals: Sum up the annual rent for all units at current market rates.
* For commercial properties: Sum up base rents, percentage rents (if applicable), and any additional income from common area maintenance (CAM) charges, property taxes, or insurance passed through to tenants.
* Example: A 10-unit apartment building charges an average of $2,500 per unit per month.
GSI = 10 units $2,500/month/unit * 12 months/year = $300,000 per year.
Step 2: Subtract Vacancy and Credit Loss
No property is 100% occupied 100% of the time, and sometimes tenants default. Estimate this loss based on historical data for the property, market averages for similar properties, or a conservative projection. A common range for residential properties might be 3-7%.
* Example (continued): Assume a 5% vacancy and credit loss rate.
Vacancy & Credit Loss = $300,000 0.05 = $15,000
* Effective Gross Income (EGI) = GSI – Vacancy & Credit Loss = $300,000 – $15,000 = $285,000
Step 3: Calculate Total Operating Expenses
Compile all recurring annual costs associated with operating the property. Remember to exclude mortgage payments, depreciation, and capital expenditures.
* Common Operating Expenses:
* Property Taxes: $30,000
* Property Insurance: $8,000
* Utilities (landlord-paid): $12,000
Property Management Fees (typically 8-12% of EGI): $285,000 0.09 = $25,650
* Repairs & Maintenance: $10,000
* Landscaping/Cleaning: $5,000
* Miscellaneous: $2,000
* Total Operating Expenses = $30,000 + $8,000 + $12,000 + $25,650 + $10,000 + $5,000 + $2,000 = $92,650
Step 4: Determine Net Operating Income (NOI)
Subtract your total operating expenses from the effective gross income.
* Example (continued):
* NOI = EGI – Total Operating Expenses = $285,000 – $92,650 = $192,350
Step 5: Apply the Cap Rate Formula
Finally, divide the NOI by the property’s market value (or proposed purchase price).
Example 1: Calculating Cap Rate for a Known Property Value
Suppose the 10-unit apartment building (with an NOI of $192,350) is currently on the market for $2,750,000.
* Cap Rate = $192,350 / $2,750,000 = 0.0699 or 6.99%
This means for every dollar you invest in this property, you can expect an unleveraged annual return of approximately 6.99% from its net operating income.
Example 2: Using Cap Rate to Estimate Property Value
Now, let’s say you’ve calculated the NOI for a similar 10-unit apartment building in the same area to be $210,000. Through market research, you’ve determined that comparable properties are trading at an average Cap Rate of 6.5%. You can use this market Cap Rate to estimate the property’s value:
* Property Value = NOI / Market Cap Rate = $210,000 / 0.065 = $3,230,769
This calculation gives you a data-backed estimate of what the property should be worth, helping you negotiate a fair price or quickly identify over- or under-priced opportunities.
Interpreting Cap Rates: What Do the Numbers Really Tell You?
Understanding how to calculate a Cap Rate is only half the battle; the real value lies in knowing how to interpret it within the broader market context.
High vs. Low Cap Rates: The Risk-Return Spectrum
* Higher Cap Rates (e.g., 7% – 10%+):
* Implication: Generally suggest a higher potential return on investment for the purchase price.
* Associated Risk: Often indicates higher risk. These properties might be in emerging markets, secondary locations, have older infrastructure requiring more maintenance, or have less stable tenant bases. They could also be “value-add” opportunities where an investor plans to significantly improve the property and increase NOI.
* Investor Profile: Attracts investors seeking higher yields and willing to take on more risk, potentially with active management strategies.
* Lower Cap Rates (e.g., 3% – 6%):
* Implication: Generally suggest a lower potential return on investment for the purchase price.
* Associated Risk: Typically indicate lower risk and greater stability. These properties are often in prime, highly desirable locations, have strong tenant demand, newer construction, or long-term, credit-worthy leases.
* Investor Profile: Attracts investors prioritizing capital preservation, stable income, and long-term appreciation over immediate high cash flow, often in highly competitive “trophy asset” markets.
Market Benchmarks and What Influences Them
Cap Rates are not static; they vary significantly based on several factors:
1. Property Type:
* Multifamily: Often trades at lower cap rates (e.g., 4-7% for stabilized assets in major metros) due to perceived stability and consistent demand.
* Industrial: Can range widely (e.g., 5-8%), with highly sought-after logistics and distribution centers commanding lower cap rates.
* Retail: Highly dependent on tenant quality and lease terms. A single-tenant net-leased property with a strong national tenant might trade at 5-7%, while multi-tenant strip malls could be 7-9%+.
* Office: Similar to retail, can vary (e.g., 6-9%) based on location, tenant credit, and lease duration.
2. Location: Prime urban cores in major cities (e.g., New York, Los Angeles, Miami) typically command lower Cap Rates than properties in secondary or tertiary markets, reflecting higher demand and perceived safety. A Class A multifamily property in a booming tech hub might trade at a 4.5% cap, while a similar property in a growing but smaller city could be 6.5%.
3. Market Cycle: In a strong economy with high demand, Cap Rates tend to compress as property values increase faster than NOI. During economic downturns or periods of uncertainty, Cap Rates may expand as investors demand higher yields for increased risk.
4. Interest Rates: There’s often an inverse relationship between interest rates and Cap Rates. When interest rates rise, the cost of borrowing increases, making it harder for investors to achieve their desired leveraged returns. To compensate, buyers may demand a higher Cap Rate (meaning a lower purchase price for the same NOI), causing Cap Rates to expand. Conversely, low interest rates can drive Cap Rate compression. As of current market conditions, rising interest rates are a significant factor influencing Cap Rate trends.
5. Property Class and Condition: Class A properties (new, top-tier locations) will typically have lower Cap Rates than Class B (well-maintained, good locations) or Class C (older, less desirable locations, often value-add opportunities).
6. Lease Terms and Tenant Quality: For commercial properties, long-term leases with credit-worthy tenants (e.g., a Fortune 500 company) reduce risk and often result in lower Cap Rates compared to properties with short-term leases or less stable tenants.
By analyzing these factors alongside the calculated Cap Rate, you gain a much deeper understanding of an investment’s true potential and inherent risks.
The Limitations of Cap Rate: When to Dig Deeper
While incredibly useful, the Cap Rate is a snapshot and has important limitations that smart investors must acknowledge:
1. Ignores Debt and Financing: The Cap Rate is an unleveraged return metric. It doesn’t account for how an investor finances the property (e.g., down payment, mortgage interest rates). For highly leveraged investments, other metrics like Cash-on-Cash Return (Annual Pre-Tax Cash Flow / Total Cash Invested) become more relevant for assessing actual investor returns.
2. Static Snapshot, Not Future Growth: The Cap Rate is based on the current Net Operating Income. It doesn’t inherently account for future NOI growth (e.g., rent increases), potential future vacancies, or anticipated capital expenditures (CapEx) like a roof replacement or major HVAC overhaul. For properties with significant potential for NOI growth or substantial future CapEx needs, a Discounted Cash Flow (DCF) analysis is a more robust valuation method.
3. Doesn’t Reflect Value-Add Potential: If you plan to acquire a property, renovate it, and significantly increase rents (a “value-add” strategy), the “going-in” Cap Rate based on current NOI might look unattractive. The true potential is reflected in the “stabilized” or “exit” Cap Rate after improvements. The Cap Rate is best for stabilized, income-producing properties.
4. Not Suitable for Vacant or Development Properties: If a property has no current income (e.g., raw land, a completely vacant building, or new construction that isn’t yet leased), it has no NOI, and therefore, a Cap Rate cannot be calculated. These types of investments require different valuation methodologies that focus on future potential income and development costs.
5. Relies on Accurate NOI: The accuracy of your Cap Rate calculation is entirely dependent on the accuracy of your NOI. Overestimating income or underestimating expenses will lead to an artificially higher Cap Rate and potentially an overvaluation of the property. Diligent due diligence on financials is critical.
Integrating Cap Rate into Your Investment Strategy: Beyond the Formula
A sophisticated investor understands that the Cap Rate is a powerful piece of the puzzle, not the entire picture. Here’s how to integrate it effectively:
1. Use it as a Screening Tool: When sifting through numerous potential deals, the Cap Rate can quickly help you filter out properties that don’t meet your initial return criteria or appear significantly mispriced compared to market benchmarks. For instance, if you target properties with a minimum 7% Cap Rate in a specific submarket, you can quickly discard properties trading at 5%.
2. Compare Like-for-Like: Always compare Cap Rates for properties with similar characteristics – same asset class, similar location, age, condition, and tenant profile. Comparing a Class A office tower in a downtown core to a Class C retail strip mall in a rural area based solely on Cap Rate is misleading.
3. Estimate Market Value: Leverage the market Cap Rate (derived from recent sales of comparable properties) to estimate what a property should be worth. This empowers you in negotiations, allowing you to present a data-backed offer or challenge an inflated asking price. If similar properties are selling at a 6.0% Cap Rate and a seller is asking a price that implies a 5.0% Cap Rate for their property, you know there’s a disconnect to investigate or negotiate.
4. Understand Market Trends: Track Cap Rate movements in your target markets. Are they compressing or expanding? This trend indicates whether the market is heating up or cooling down, informing your buying and selling decisions. A compressing market might suggest it’s a good time to sell, while an expanding market could signal buying opportunities.
5. Complement with Other Metrics: Always use the Cap Rate in conjunction with other financial metrics for a holistic view:
* Cash-on-Cash Return: Essential for understanding your actual leveraged return.
* Internal Rate of Return (IRR): A more comprehensive measure that accounts for the time value of money and all cash flows over the investment’s holding period.
* Return on Equity (ROE): Measures the return on your invested capital, particularly useful for long-term hold strategies.
* Gross Rent Multiplier (GRM): A simpler, less precise metric often used for smaller residential properties, indicating the ratio of property price to annual gross rental income.
* Discounted Cash Flow (DCF) Analysis: For complex, long-term investments, especially those with variable future cash flows or significant CapEx, DCF provides the most detailed valuation.
By integrating the Cap Rate strategically, you move beyond mere calculation to informed decision-making, positioning yourself for greater success in real estate investing.