Understanding Expense Ratios in ETFs: The Complete Guide to Minimizing Costs
In the world of investing, there are many factors beyond your control, such as market volatility, geopolitical shifts, and economic cycles. However, one of the few variables you can influence—and one that has a profound impact on your long-term wealth—is the cost of your investments. For retail investors and active traders alike, understanding the expense ratio of an Exchange-Traded Fund (ETF) is the cornerstone of a successful financial strategy.
An expense ratio may seem like a negligible fraction of a percentage, but over a multi-decade horizon, these small numbers can compound into significant sums of money. As we look toward the financial landscape of 2026, the “fee war” among major fund providers has driven costs lower than ever before, yet hidden complexities remain. This guide will break down everything you need to know about ETF expense ratios, how they are calculated, and how you can optimize your portfolio to ensure you keep more of your hard-earned returns.
What is an ETF Expense Ratio? (The Basics)
At its core, an ETF expense ratio represents the annual fee that an investment company charges to manage a fund. Expressed as a percentage of the fund’s daily net assets, this fee covers the operational costs associated with running the ETF. These costs include portfolio management, administrative services, compliance, legal fees, marketing, and custodial services.
Mathematically, the formula is simple:
**Expense Ratio = (Total Fund Operating Expenses / Total Fund Assets)**
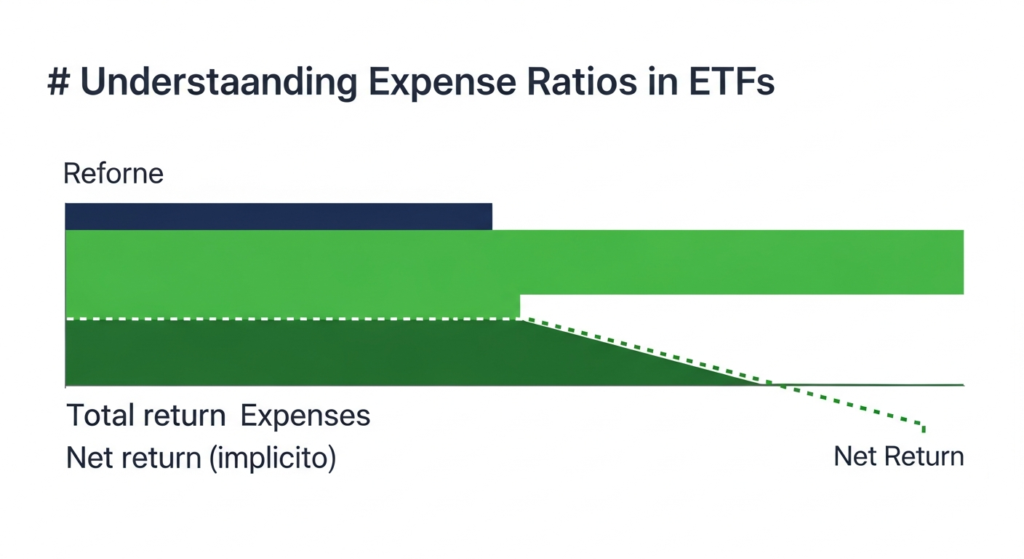
For example, if you invest $10,000 in an ETF with an expense ratio of 0.10%, you are paying $10 per year in management fees. It is important to note that you will never receive a “bill” for these fees. Instead, the expense ratio is deducted directly from the fund’s Net Asset Value (NAV) on a daily, pro-rated basis. This means the performance you see in your brokerage account is already “net of fees.”
In 2026, the industry standard for broad-market index ETFs has settled into a ultra-low range, often between 0.03% and 0.09%. However, more specialized funds, such as thematic ETFs or actively managed products, can charge significantly more, sometimes exceeding 0.75% or 1.00%. For the cost-conscious investor, identifying the line between “fair value” and “overpriced” is the first step toward optimization.
Why Expense Ratios Matter for Long-Term Wealth
The most dangerous aspect of expense ratios is their ability to erode the power of compounding. While a 0.50% difference in fees might seem trivial in a single year, the cumulative effect over twenty or thirty years is staggering. When you pay a fee, you aren’t just losing that specific dollar amount; you are losing the future growth that those dollars would have generated if they remained invested.
Consider a hypothetical scenario: Two investors, Alice and Bob, each invest $50,000 into different ETFs that both track the S&P 500 and earn an average annual return of 7% before fees.
* Alice chooses a low-cost fund with an expense ratio of **0.05%**.
* Bob chooses a legacy fund with an expense ratio of **0.55%**.
After 30 years, Alice’s portfolio would grow to approximately **$374,500**. Bob’s portfolio, hindered by the higher fee, would grow to approximately **$324,500**. By choosing the more expensive fund, Bob sacrificed **$50,000**—the entirety of his original principal—to management fees and lost opportunity costs.
For retail investors aiming for retirement, minimizing the expense ratio is one of the most effective ways to “beat” the average investor. In a 2026 market where alpha (excess return) is increasingly difficult to find, reducing your “negative alpha” (fees) is the most reliable way to increase your net take-home pay from the markets.
Active vs. Passive ETFs: The Cost Breakdown
The primary driver of an ETF’s expense ratio is its management style. Understanding the difference between passive and active management is essential for setting expectations regarding costs.
#
Passive ETFs (Index Funds)
Passive ETFs are designed to track a specific benchmark, such as the S&P 500, the Nasdaq-100, or a total bond market index. Because the “management” involves simply replicating a pre-defined list of stocks, the overhead is low. These funds often utilize algorithmic trading to rebalance, allowing providers like Vanguard, BlackRock (iShares), and State Street (SPDR) to offer them at rock-bottom prices. In 2026, many of these “core” holdings have expense ratios below 0.05%.
#
Active ETFs
Actively managed ETFs involve a portfolio manager or a team of analysts who make discretionary decisions to buy or sell assets in an attempt to outperform a benchmark. Because this requires human expertise, extensive research, and more frequent trading, the costs are higher. Active ETFs typically range from 0.40% to 0.90%.
The debate for the modern trader is whether the potential for outperformance justifies the higher fee. Statistics consistently show that over long periods, the majority of active managers fail to beat their benchmarks after fees are deducted. Therefore, for the “core” of a portfolio, low-cost passive ETFs are generally preferred, while active ETFs might be reserved for “satellite” positions in niche markets where human insight adds more visible value.
Hidden Costs Beyond the Expense Ratio
While the expense ratio is the most visible cost, it is not the *total* cost of owning an ETF. Smart traders and investors must also account for “hidden” costs that can impact the bottom line, particularly in volatile market environments.
#
1. Bid-Ask Spreads
The bid-ask spread is the difference between the highest price a buyer is willing to pay and the lowest price a seller is willing to accept. For highly liquid ETFs (like SPY or QQQ), the spread is often just a penny. However, for niche, low-volume ETFs, the spread can be wide. If you buy an ETF with a 0.50% spread and sell it shortly after, you have effectively paid a “transaction tax” that isn’t reflected in the expense ratio.
#
2. Tracking Error
A passive ETF’s job is to mirror its index. If an index rises 10% but the ETF only rises 9.8% (after accounting for the expense ratio), that 0.1% discrepancy is known as a tracking error. This can be caused by transaction costs within the fund or the timing of dividend distributions. A high tracking error is an implicit cost to the investor.
#
3. Premium/Discount to NAV
Unlike mutual funds, ETFs trade on an exchange like stocks. This means the market price can occasionally deviate from the Net Asset Value (the actual value of the underlying holdings). If you buy an ETF at a 1% premium, you are overpaying for the assets.
#
4. Taxes and Portfolio Turnover
While ETFs are generally more tax-efficient than mutual funds due to “in-kind” creations and redemptions, high-turnover ETFs (especially active ones) can still trigger capital gains distributions. These taxes are a drag on your total return, making it vital to look at the “Tax-Cost Ratio” in addition to the expense ratio.
How to Evaluate a “Good” Expense Ratio in 2026
As we navigate 2026, the definition of a “cheap” ETF has evolved. Expense ratios vary by asset class and geography, so comparing a domestic stock ETF to an emerging markets bond ETF is not an apples-to-apples comparison. Here are the 2026 benchmarks for retail investors:
* **U.S. Large-Cap (S&P 500/Total Market):** 0.02% to 0.07% is excellent. Anything above 0.15% is likely overpriced for a basic index.
* **Developed International Markets:** 0.05% to 0.15% is the competitive range.
* **Emerging Markets:** These are more expensive to trade and manage. 0.10% to 0.35% is considered low-cost for this category.
* **Sector & Thematic ETFs:** Funds focusing on AI, clean energy, or cybersecurity involve more specialized indexing. Expect to pay 0.30% to 0.65%.
* **Fixed Income (Bonds):** 0.04% to 0.12% for aggregate bond funds. High-yield or “junk” bond ETFs typically range from 0.25% to 0.50%.
When evaluating a fund, always check if there is a “fee waiver” in place. Some newer ETFs offer a temporary reduction in the expense ratio to attract assets. Ensure you know the “Gross Expense Ratio” (the fee without the waiver) to understand what you might pay in the future once the promotion expires.
Strategies for Minimizing Your Total Cost of Ownership
Minimizing costs requires a proactive approach. Retail investors should look beyond the H1 headline and implement these strategies to protect their portfolios:
1. **Use Low-Cost “Core” Holdings:** Build the bulk of your portfolio (70-80%) using broad-market ETFs with expense ratios under 0.10%. Save the more expensive, thematic funds for small, speculative positions.
2. **Consolidate Providers:** Many brokerages offer their own line of proprietary, commission-free, low-cost ETFs. Utilizing these can sometimes shave a few basis points off your total costs.
3. **Mind the Liquidity:** For traders, a fund with a 0.15% expense ratio but massive liquidity (tight spreads) may be cheaper than a 0.05% fund with high spreads if the holding period is short.
4. **Avoid Frequent Trading of Niche Funds:** The bid-ask spreads and transaction costs of specialized ETFs can quickly negate any potential gains. If you are trading high-cost ETFs, ensure your strategy accounts for the “friction” of entering and exiting the position.
5. **Utilize ETF Screeners:** Use tools like Morningstar or specialized ETF databases to sort funds by “Net Expense Ratio.” Always look for the lowest cost fund that provides the specific exposure you need.
FAQ: Frequently Asked Questions about ETF Expenses
**Q1: Is the expense ratio deducted from my brokerage account balance?**
No. The expense ratio is taken directly from the fund’s assets. You will see it reflected as a slight reduction in the fund’s daily performance. It is an internal cost that reduces the Net Asset Value (NAV) of the shares you hold.
**Q2: Does a higher expense ratio mean better performance?**
In the world of ETFs, the opposite is often true. Research generally shows that lower-cost funds tend to outperform higher-cost peers over long periods, primarily because they have a lower “hurdle rate” to overcome. A high fee is a guaranteed loss, while “alpha” is never guaranteed.
**Q3: What is the difference between Gross and Net Expense Ratios?**
The Gross Expense Ratio is the total cost to run the fund. The Net Expense Ratio is what investors actually pay after any fee waivers or reimbursements from the fund manager. Always look at the Net ratio for current costs, but check the expiration date of any waivers.
**Q4: Are there ETFs with 0% expense ratios?**
Yes, a few providers have introduced 0% (or even “negative” through fee waivers) expense ratio funds to gain market share. While these are excellent for minimizing costs, always check the liquidity and tracking error to ensure the “free” fund isn’t costing you money in other ways.
**Q5: How often do expense ratios change?**
Expense ratios are reviewed annually and can be adjusted. In the current competitive environment of 2026, most changes have been downward as providers compete for retail capital. These changes are detailed in the fund’s annual prospectus.
Conclusion
Understanding expense ratios is perhaps the most underrated skill for a retail investor. While it is exciting to chase the next hot sector or time the market perfectly, the math of investment fees is certain. Every basis point you save is a basis point added to your compounding returns.
As we look at the investment landscape of 2026, the tools available to investors have never been more powerful or more affordable. By prioritizing low-cost core holdings, remaining vigilant about hidden costs like bid-ask spreads, and regularly auditing your portfolio for “fee creep,” you can ensure that your wealth is working for you—not for the fund managers. In the long run, the most successful investors aren’t necessarily those who find the best-performing stocks, but those who are the most disciplined about the costs they can control.