Master the Visuals: How to Read Stock Market Charts for Budget-Conscious Investors
The financial landscape of 2026 has transformed the way retail investors interact with the stock market. Gone are the days when high-level technical analysis was locked behind expensive Bloomberg Terminals or proprietary institutional software. Today, the democratization of data allows anyone with an internet connection to access professional-grade charting tools for little to no cost. However, having access to the data is only half the battle; knowing how to interpret the sea of red and green bars is what separates successful traders from those who treat the market like a casino. For the modern retail investor looking to minimize overhead while maximizing insight, understanding how to read stock market charts is the ultimate skill. This guide will walk you through the essential components of technical analysis, focusing on free tools and fundamental principles that help you identify trends, manage risk, and execute trades with precision and confidence.
1. The Foundation: Understanding Chart Types and Candlestick Anatomy
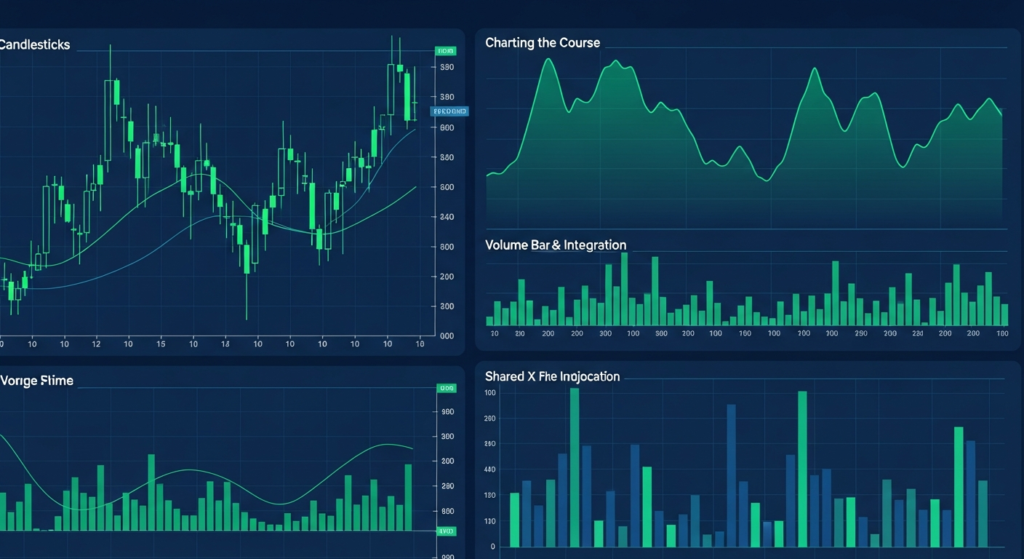
Before diving into complex strategies, you must understand the medium. While there are several ways to visualize price action, two dominate the retail space: line charts and candlestick charts. For long-term “set and forget” investors, a simple line chart—which connects closing prices over time—offers a clean view of the general trend. However, for those looking to time their entries or understand market sentiment, candlesticks are the industry standard.
A candlestick chart provides four data points for every time period: the Open, High, Low, and Close (OHLC). The “body” of the candle represents the range between the opening and closing prices. If the candle is green (or white), the stock closed higher than it opened. If it is red (or black), it closed lower. The thin lines protruding from the top and bottom, known as “wicks” or “shadows,” represent the highest and lowest prices reached during that period.
Why does this matter for a budget-conscious trader? Candlesticks tell a story of a battle between buyers (bulls) and sellers (bears). A candle with a long bottom wick suggests that sellers tried to push the price down, but buyers stepped in to push it back up before the period ended. This is a “rejection” of lower prices and can signal a potential reversal. By mastering candlestick patterns like the “Hammer” or “Doji,” you can spot shifts in momentum without paying for expensive AI-driven signal services.
2. Navigating Timeframes: Matching Charts to Your Financial Goals
One of the most common mistakes new traders make is looking at the wrong timeframe. A stock might look like it is crashing on a 5-minute chart while remaining in a perfectly healthy uptrend on a weekly chart. To minimize costs and avoid “over-trading” (which racks up commissions or spread costs), you must select a timeframe that aligns with your strategy.
* **Intraday Charts (1-minute to 15-minute):** Used primarily by day traders. These require high focus and can be stressful. For retail investors looking to minimize costs, these are often the “noisiest” and most difficult to trade successfully.
* **Daily Charts:** The gold standard for swing traders. Each candle represents one full trading day. This timeframe filters out daily noise and provides a clearer picture of significant price movements.
* **Weekly and Monthly Charts:** Essential for long-term investors. These charts show the “big picture” of a company’s multi-year growth.
In 2026, many free platforms allow you to view multiple timeframes simultaneously. A low-cost strategy often involves “Top-Down Analysis.” Start with the weekly chart to find the overall direction (the trend), use the daily chart to find an area of interest, and use the hourly chart to fine-tune your entry point. This disciplined approach prevents you from chasing “fake-out” moves on shorter timeframes.
3. Volume and Price Action: The Language of Market Conviction
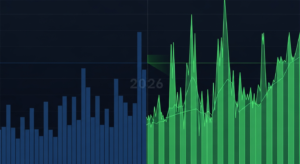
If price is the “what” of the market, volume is the “why.” Volume represents the total number of shares traded during a specific period. On most free charting platforms, volume is displayed as a series of vertical bars at the bottom of the chart.
Reading volume is one of the most cost-effective ways to confirm a trend. High volume during a price increase indicates “institutional conviction”—meaning large funds and banks are likely buying, which adds validity to the move. Conversely, if a stock price is rising but volume is declining, it suggests the move is weak and may soon reverse.
For the retail trader, volume acts as a lie detector. Many paid subscription services claim to offer “dark pool” data or “insider alerts,” but much of this information is actually reflected in the public volume bars if you know where to look. Look for “Volume Climaxes”—massive spikes in volume that often occur at the end of a long trend, signaling that the last of the buyers or sellers have entered and a reversal is imminent. By focusing on volume, you are essentially following the “smart money” for free.
4. Essential Technical Indicators for Low-Overhead Trading
While it is tempting to clutter your screen with dozens of colorful lines, the most successful retail traders often use a “less is more” approach. Indicators are mathematical calculations based on price and volume; they are “lagging,” meaning they tell you what happened in the past. Here are three essential, free indicators that provide the most value:
* **Moving Averages (SMA and EMA):** The Simple Moving Average (SMA) smooths out price data to create a single flowing line. The 50-day and 200-day SMAs are the most watched. When the price is above these lines, the trend is bullish. When it’s below, it’s bearish. The “Golden Cross” (50-day crossing above the 200-day) is a classic buy signal available on any basic charting tool.
* **Relative Strength Index (RSI):** This momentum oscillator measures the speed and change of price movements on a scale of 0 to 100. Generally, an RSI above 70 indicates a stock is “overbought” (too expensive), while an RSI below 30 suggests it is “oversold” (potentially a bargain).
* **MACD (Moving Average Convergence Divergence):** This helps identify changes in the strength, direction, momentum, and duration of a trend. It is excellent for spotting “divergence”—when the price makes a new high but the MACD doesn’t, signaling that the rally is losing steam.
By sticking to these standard indicators, you ensure you are looking at the same data as the rest of the market, which creates “self-fulfilling prophecies” in price action.
5. Identifying Support, Resistance, and Trendlines
Technical analysis is essentially the study of human psychology mapped onto a grid. Support and Resistance are the bread and butter of this study.
* **Support:** This is the “floor.” It is a price level where a downtrend tends to pause due to a concentration of buying demand. When a stock price falls to support, buyers who missed the previous move often jump in, preventing the price from falling further.
* **Resistance:** This is the “ceiling.” It is a price level where an uptrend tends to pause as sellers outnumber buyers.
Drawing trendlines is a free and powerful way to visualize these levels. A basic uptrend line is drawn by connecting the higher lows of a stock’s price path. As long as the price stays above that line, the trend is intact. In 2026, you don’t need expensive automated pattern-recognition software; a simple manual line drawn from point A to point B is often more accurate because it reflects your own strategic criteria. Learning to “buy the support” and “sell the resistance” is the most effective way to minimize losses and avoid buying at the absolute peak of a hype cycle.
6. Using Free and Low-Cost Charting Software in 2026
To execute the strategies mentioned above, you need a reliable platform. Fortunately, the competition in the fintech space has made high-quality charting accessible.
* **TradingView:** The gold standard for modern retail traders. Their free tier offers world-class charting, most essential indicators, and a social community. Even their basic paid tiers are significantly cheaper than legacy platforms.
* **Finviz:** An incredible tool for “screening” stocks. While its charts are more basic, its ability to filter stocks by technical criteria (e.g., “stocks at a 52-week low with an RSI under 30”) is unmatched for a free service.
* **Brokerage-Integrated Tools:** Many low-cost brokers (like Charles Schwab, Fidelity, or newer zero-commission apps) have integrated advanced charting directly into their platforms. Tools like Thinkorswim (now part of Schwab) provide professional-level analysis for anyone with a brokerage account.
* **Yahoo Finance:** Still a reliable, free source for quick checks on daily and weekly charts with basic indicator overlays.
The key to minimizing costs in 2026 is to avoid “indicator bloat.” You do not need to pay for proprietary “black box” algorithms. The most successful traders use the free tools provided by these platforms to build a simple, repeatable process.
FAQ: Frequently Asked Questions about Reading Charts
**Q: Do I need a math degree to understand stock charts?**
A: Absolutely not. While the indicators are based on math, the charts themselves are visual representations of supply and demand. If you can read a weather map or a basic bar graph, you can learn to read a stock chart. It is more about pattern recognition and discipline than complex arithmetic.
**Q: Is technical analysis better than fundamental analysis?**
A: They serve different purposes. Fundamental analysis (earnings, debt, management) tells you *what* to buy. Technical analysis (charts) tells you *when* to buy. For the budget-conscious investor, using a mix of both—buying fundamentally strong companies when the chart shows they are at a support level—is the most effective strategy.
**Q: Can I read charts effectively on a mobile phone?**
A: While mobile apps have improved significantly by 2026, it is always better to do your initial analysis on a desktop or tablet. A larger screen allows you to see more historical data and draw trendlines more accurately. Use the mobile app for monitoring, but the desktop for planning.
**: How long does it take to learn how to read charts?**
A: You can learn the basics (candlesticks, support/resistance) in a weekend. However, mastering the “nuance”—such as identifying false breakouts—takes several months of consistent practice. Many traders use “paper trading” (simulated trading with fake money) to practice reading charts without risking capital.
**Q: Are free charts “delayed” compared to paid ones?**
A: It depends on the exchange. For many US stocks, free platforms like TradingView or your broker provide real-time data. For some international exchanges or specific commodities, there might be a 15-minute delay on free versions. For most swing investors and long-term traders, a 15-minute delay is negligible.
Conclusion
Reading stock market charts is not about predicting the future with 100% certainty; it is about shifting the probabilities in your favor. By 2026, the tools available to the average retail investor have reached a level of sophistication that was once reserved for Wall Street elites. By mastering the anatomy of candlesticks, understanding the importance of volume, and identifying key support and resistance levels, you can navigate the markets with a professional edge while keeping your costs at a minimum.
Remember that the most expensive mistake a trader can make is not the cost of a software subscription, but the cost of trading without a plan. Use the free resources at your disposal—TradingView, your brokerage’s platform, and educational content—to build a strategy based on price action and logic. Keep your charts clean, your emotions in check, and your eyes on the long-term trend. With patience and practice, the “language of the charts” will become second nature, allowing you to grow your wealth efficiently and affordably.