Navigating the complexities of the stock market requires a robust framework for decision-making. For long-term investors aiming to build sustainable wealth, understanding fundamental analysis stocks is not merely an option but a core competency. This rigorous approach evaluates a company’s intrinsic value, scrutinizing its financial health, operational efficiency, competitive landscape, and management quality to identify equities that are genuinely undervalued or overvalued by the market.
Unlike speculative trading that often chases short-term price movements, an in-depth equity fundamental analysis seeks to understand the underlying business. It provides a comprehensive perspective, allowing investors to make informed decisions based on a company’s true economic potential rather than fleeting market sentiment. By diving deep into the available data, you can uncover opportunities that align with a strategy focused on sustainable growth and profitability.
What is Fundamental Analysis for Stocks?
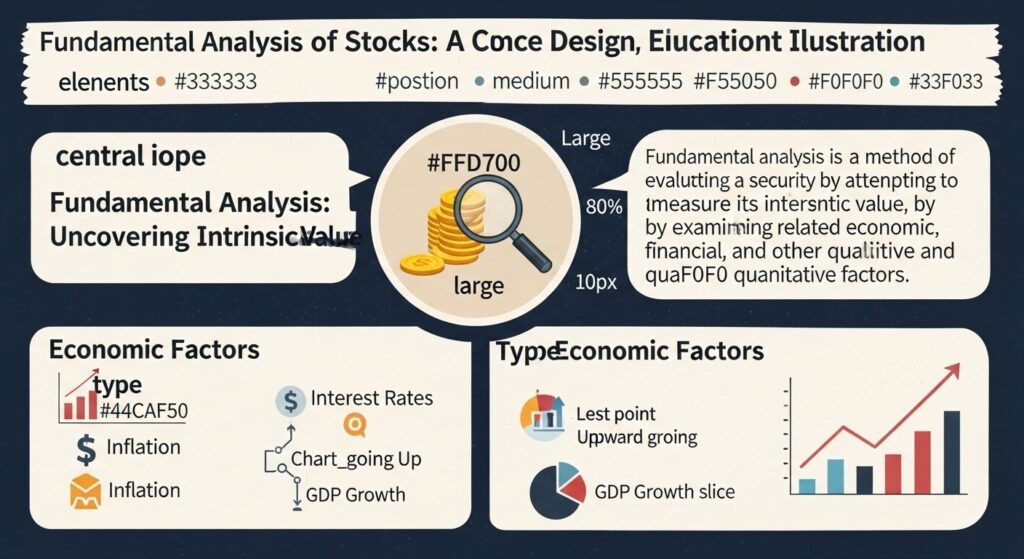
Equity fundamental analysis is a method of evaluating a security in an attempt to measure its intrinsic value, by examining related economic, industry, and company-specific factors. Its ultimate goal is to arrive at a value that an investment analyst can compare with the security’s current market price, with the aim of profiting from the eventual correction of the market price to its intrinsic value. Investors utilize this forward-looking investment analysis approach to determine whether a company’s stock is currently trading at a fair price, at a discount (undervalued), or at a premium (overvalued).
This comprehensive method stands in contrast to approaches that focus solely on price movements. It involves sifting through public data, including financial statements, industry trends, and economic indicators, to form a holistic view of a company’s operational strength and future prospects. A key attribute of this strategy is its long-term orientation, as it seeks to identify businesses with sustainable competitive advantages and strong potential for future earnings.
Why is Fundamental Analysis Crucial for Stock Investors?
Understanding a company’s underlying health and prospects is not merely an academic exercise; it forms the bedrock of sound investment decisions. This approach reduces risk, identifies value, and fosters a long-term mindset, all critical for successful participation in the equity markets. Investors who perform thorough fundamental evaluations are better equipped to navigate market volatility and avoid speculative pitfalls.
- Identifying Intrinsic Value: The primary benefit of conducting a robust business analysis for stock picking is the ability to estimate a company’s intrinsic value. This allows investors to buy stocks for less than they are worth, providing a margin of safety.
- Informed Decision-Making: By examining a company’s financials, industry position, and management, investors gain a deeper understanding, leading to more rational and less emotionally driven investment choices.
- Risk Mitigation: A thorough evaluation of financial health, debt levels, and competitive landscape helps identify companies with strong financial resilience and reduces the risk of investing in financially unstable entities.
- Long-Term Wealth Creation: Focusing on solid businesses with strong fundamentals aligns with a value-oriented, long-term investment strategy, which historically has been a powerful engine for wealth creation.
- Competitive Advantage: Investors who possess the skills to analyze stocks fundamentally can identify opportunities that might be overlooked by the broader market, gaining a potential edge.
[INLINE IMAGE 1: diagram illustrating the long-term investment philosophy of fundamental analysis]
Key Components of Stock Fundamental Analysis
To effectively analyze stocks fundamentally, investors must consider a range of factors that collectively paint a picture of a company’s health and potential. These components span from detailed financial reports to broader economic trends and the quality of leadership.
Financial Statements: The Foundation
The primary source of quantitative data for evaluating a company’s intrinsic value is its financial statements. These standardized reports provide a snapshot of a company’s financial performance and position.
- Income Statement (Profit & Loss Statement): Reveals a company’s revenues, expenses, and profit over a period (e.g., quarter or year). Key metrics include revenue growth, gross margin, operating margin, and net income (earnings per share – EPS).
- Balance Sheet: Provides a snapshot of a company’s assets, liabilities, and shareholders’ equity at a specific point in time. It indicates financial structure, liquidity, and solvency. Analysts examine current assets, current liabilities, long-term debt, and equity.
- Cash Flow Statement: Tracks the actual cash generated and used by a company over a period, categorized into operating, investing, and financing activities. It’s crucial for understanding a company’s ability to generate cash and fund its operations and growth, often considered less susceptible to accounting manipulations than net income.
Industry and Economic Analysis
A company does not operate in a vacuum. Its performance is heavily influenced by the industry it belongs to and the broader economic environment.
- Industry Analysis: Understanding the competitive landscape, industry growth rates, barriers to entry, regulatory environment, and technological advancements is vital. Porter’s Five Forces is a common framework used here.
- Economic Indicators: Macroeconomic factors such as GDP growth, inflation rates, interest rates, consumer spending, and unemployment rates can significantly impact a company’s profitability and future outlook. A robust business analysis considers how these elements might affect demand for a company’s products or services.
Management Quality and Corporate Governance
While often harder to quantify, the quality of a company’s leadership and its corporate governance structure are paramount to its long-term success.
- Management Team: Evaluating the experience, track record, integrity, and strategic vision of the management team is crucial. Analysts look at past performance, capital allocation decisions, and communication with shareholders.
- Corporate Governance: This refers to the system of rules, practices, and processes by which a company is directed and controlled. Strong governance ensures accountability, transparency, and fairness, protecting shareholder interests. Factors include board independence, executive compensation practices, and shareholder rights.
How to Perform Fundamental Analysis on Stocks: A Step-by-Step Guide
Conducting a comprehensive equity fundamental analysis requires a systematic approach. Following these steps can help investors thoroughly evaluate a company and make informed decisions about its investment potential.
Step 1: Understand the Business Model
Before diving into numbers, grasp what the company does, how it makes money, who its customers are, and what its core products or services entail. Research its market position, competitive advantages (moat), and long-term growth drivers. This initial step provides crucial context for all subsequent financial evaluations.
Step 2: Analyze Financial Statements
Obtain the company’s annual reports (10-K) and quarterly reports (10-Q) from investor relations websites or the SEC EDGAR database. Focus on trends over several years (e.g., 5-10 years) rather than just a single period.
- Revenue Growth: Is it consistent? Is it accelerating or decelerating?
- Profitability: Examine gross, operating, and net profit margins. Are they stable or improving?
- Balance Sheet Health: Assess liquidity (current ratio), solvency (debt-to-equity ratio), and asset efficiency.
- Cash Flow: Look for strong operating cash flow. Can the company fund its operations and growth without excessive borrowing?
Step 3: Evaluate Valuation Metrics
After understanding the financials, apply various valuation models to estimate the company’s intrinsic value and compare it to its current market price. This is where you determine if the stock is undervalued or overvalued.
- Relative Valuation: Compare the company’s valuation ratios (like P/E ratio, P/B ratio, EV/EBITDA) to its industry peers and historical averages.
- Absolute Valuation (Intrinsic Value Models):
- Discounted Cash Flow (DCF): Projects future free cash flows and discounts them back to the present value using a suitable discount rate. This is often considered the most robust method for determining intrinsic value.
- Dividend Discount Model (DDM): Values a company based on the present value of its future dividends, suitable for mature, dividend-paying companies.
Step 4: Assess Qualitative Factors
Finally, integrate the non-financial aspects that influence a company’s long-term success. These include the strength of its brand, intellectual property, management quality, corporate culture, customer loyalty, and environmental, social, and governance (ESG) practices.
Consider the company’s competitive advantage or “moat”—what prevents competitors from eroding its profits? Is it a strong brand, proprietary technology, network effects, or cost advantage?
[INLINE IMAGE 2: infographic detailing the four-step process of fundamental stock analysis]
Quantitative vs. Qualitative Factors in Stock Analysis
Investment analysis for equities involves a blend of measurable data and subjective assessments. Both quantitative and qualitative factors are essential for a holistic view of a company’s investment potential.
| Factor Type | Examples | Importance in Decision Making |
|---|---|---|
| Quantitative Factors | Revenue growth, Net income, EPS, P/E Ratio, Debt-to-Equity Ratio, Free Cash Flow, ROE | Provide measurable data on financial performance and health. Essential for valuation and financial stability assessment. |
| Qualitative Factors | Management quality, Brand strength, Competitive advantage (moat), Corporate governance, Industry trends, Product innovation, Customer loyalty, ESG practices | Explain the “why” behind the numbers; crucial for assessing long-term sustainability, growth potential, and risk resilience. |
While quantitative factors offer concrete data points for analysis and comparison, qualitative factors provide the context and forward-looking insights necessary to understand the sustainability of a company’s competitive position and its ability to execute its strategy. A thorough valuation requires integrating both perspectives.
Fundamental Analysis vs. Technical Analysis: A Comparison
When analyzing stocks, investors often encounter two primary schools of thought: fundamental analysis and technical analysis. While both aim to identify investment opportunities, their methodologies, focuses, and time horizons differ significantly.
| Aspect | Fundamental Analysis | Technical Analysis |
|---|---|---|
| Focus | Intrinsic value of a company; financial health, business model, industry, economy. | Price movements and trading volume; supply and demand dynamics. |
| Time Horizon | Long-term (months to years). | Short-term to medium-term (days to months). |
| Primary Tools | Financial statements, economic reports, news, industry research, management interviews, valuation models. | Price charts, technical indicators (e.g., moving averages, RSI, MACD), volume analysis. |
| Goal | Identify undervalued or overvalued securities based on their true economic worth. | Forecast future price movements based on historical price patterns and market psychology. |
| Key Assumption | Market price will eventually reflect intrinsic value. | All known information is reflected in the price; prices move in trends that can be identified and exploited. |
While fundamental evaluations look at the “why” behind a company’s stock price, technical analysis focuses on the “what” — the actual price action itself. Many successful investors find value in combining elements of both approaches, using fundamental insights to select strong companies and technical analysis to optimize entry and exit points.
Limitations and Criticisms of Fundamental Analysis
Despite its widely recognized benefits, fundamental evaluations are not without their challenges and criticisms. Investors must be aware of these limitations to apply the approach effectively and avoid potential pitfalls.
- Time-Consuming: A thorough business analysis for stock picking demands significant time and effort to research, analyze financial statements, and understand industry dynamics.
- Subjectivity: Estimating intrinsic value, especially through models like DCF, involves making assumptions about future growth rates, discount rates, and terminal values. These assumptions can be subjective and lead to varying valuation estimates.
- Information Asymmetry: Retail investors may not have access to the same depth of information or analytical tools as institutional investors, potentially putting them at a disadvantage.
- Market Irrationality: In the short term, market prices can be driven by sentiment, news, and irrational exuberance or fear, causing them to deviate significantly from intrinsic value. It may take a long time for the market to correct.
- Backward-Looking Data: Financial statements are historical. While they provide trends, they don’t guarantee future performance, and unforeseen events can drastically alter a company’s trajectory.
Common Mistakes in Fundamental Analysis
Even experienced investors can stumble when performing intrinsic value assessment. Recognizing these common errors can help improve the accuracy and effectiveness of your analysis:
- Ignoring Qualitative Factors: Focusing purely on numbers and neglecting the strength of management, brand, or competitive moat can lead to incomplete and potentially flawed conclusions.
- Confirmation Bias: Seeking out information that only confirms a pre-existing belief about a stock, rather than objectively evaluating all available data, is a significant pitfall.
- Over-reliance on a Single Metric: Judging a company solely on its P/E ratio, for instance, without considering debt, cash flow, or growth prospects, can be misleading.
- Lack of Industry Understanding: Analyzing a company without a deep understanding of its industry’s specific drivers, challenges, and competitive dynamics can lead to incorrect forecasts.
- Incorrect Assumptions in Valuation Models: Small changes in growth rates or discount rates in DCF models can lead to drastically different intrinsic values, making realistic and conservative assumptions crucial.
- Failure to Update Analysis: Companies and markets are dynamic. Relying on outdated analysis without regularly reviewing new financial reports or market developments can be costly.
Key Financial Ratios and Valuation Models
To accurately assess a company’s financial health and estimate its intrinsic value, investors rely on a suite of financial ratios and sophisticated valuation models. These tools transform raw financial data into actionable insights.
| Ratio | Category | Formula/Definition | What it Indicates |
|---|---|---|---|
| P/E Ratio | Valuation | Share Price / Earnings Per Share (EPS) | How much investors are willing to pay per dollar of earnings. A higher P/E often indicates growth expectations. |
| EPS | Profitability | Net Income / Number of Outstanding Shares | The portion of a company’s profit allocated to each outstanding share of common stock. |
| ROE | Profitability | Net Income / Shareholders’ Equity | How efficiently a company is using shareholders’ investments to generate profits. Higher is generally better. |
| Debt-to-Equity | Solvency | Total Debt / Shareholders’ Equity | The proportion of equity and debt used to finance a company’s assets. Higher indicates more reliance on debt. |
| Current Ratio | Liquidity | Current Assets / Current Liabilities | A company’s ability to meet its short-term obligations (those due within one year). A ratio of 2.0 or higher is often considered healthy. |
| Gross Margin | Profitability | (Revenue – Cost of Goods Sold) / Revenue | The percentage of revenue left after deducting the direct costs of producing goods or services. |
| Price-to-Book (P/B) | Valuation | Share Price / Book Value Per Share | Compares a company’s market value to its book value. Useful for asset-heavy industries. |
Beyond ratios, Discounted Cash Flow (DCF) and Dividend Discount Models (DDM) are central to absolute valuation. DCF projects a company’s future Free Cash Flows (FCF) and discounts them back to the present using a weighted average cost of capital (WACC). This provides a single intrinsic value estimate. DDM, while less universally applicable, is robust for stable, dividend-paying companies, valuing them based on the present value of their expected future dividends.
Conclusion
Mastering the intricacies of fundamental analysis for stocks is a cornerstone for any serious investor aiming to achieve long-term financial success. By meticulously examining a company’s financial health, understanding its industry dynamics, and assessing the quality of its management, you equip yourself with the knowledge to identify truly valuable investment opportunities. This comprehensive approach transcends mere price speculation, fostering a disciplined mindset focused on the underlying business rather than fleeting market sentiment. While it demands time and a critical eye, the rewards of identifying undervalued companies with strong prospects far outweigh the effort. Ultimately, fundamental evaluation empowers you to make informed, confident investment decisions that stand the test of time, helping you build lasting wealth.
To deepen your understanding of the broader market landscape and various investment strategies, return to our central resource: [PILLAR LINK: Stock Market Investing Guide]
Sources & References
- Graham, B., & Dodd, D. L. (2002). Security Analysis: The Classic 1934 Edition. McGraw-Hill Professional. (Original work published 1934)
- Buffett, W. E. (Yearly). Berkshire Hathaway Shareholder Letters. Available at: berkshirehathaway.com
- Damodaran, A. (2012). Investment Valuation: Tools and Techniques for Determining the Value of Any Asset (3rd ed.). Wiley.
- U.S. Securities and Exchange Commission (SEC). EDGAR Database. Available at: sec.gov
About the Author
Kaelen Silva, Financial Empowerment Coach — I help individuals navigate the complexities of financial markets and build lasting wealth through smart investing, disciplined trading, and practical money management.
Reviewed by David Chang, Senior Financial Editor — Last reviewed: April 06, 2026